Improving Presto Latencies with Alluxio Data Caching
Facebook: Rohit Jain, James Sun, Ke Wang, Shixuan Fan, Biswapesh Chattopadhyay, Baldeep Hira
Alluxio: Bin Fan, Calvin Jia, Haoyuan Li
The Facebook Presto team has been collaborating with Alluxio on an open source data caching solution for Presto.
This is required for multiple Facebook use-cases to improve query latency for queries that scan data from remote sources such as HDFS.
We have observed significant improvements in query latencies and IO scans in our experiments.
We found Alluxio data caching to be useful for multiple use-cases in the Facebook environment. For one of the Facebook internal use cases we observed query latencies improved by 33% (P50), 54% (P75), and 48% (P95). We also recorded 57% improvement in IO for remote data source scans.
Presto Architecture
Presto's architecture allows storage and computation to scale independently. However, scanning data from remote storage can be a costly operation, and it makes achieving interactive query latency a challenge.
Presto workers are responsible for executing query plan fragments on the data scanned from the independent and typically remote data sources.
Presto workers do not store any data for remote data sources which enables the computation to grow elastically.
The architecture diagram below highlights the data read paths from a remote HDFS source.
Each worker independently reads data from the remote data source. In this blog we will be only talking about optimizations done in the read
operations from the remote data source.
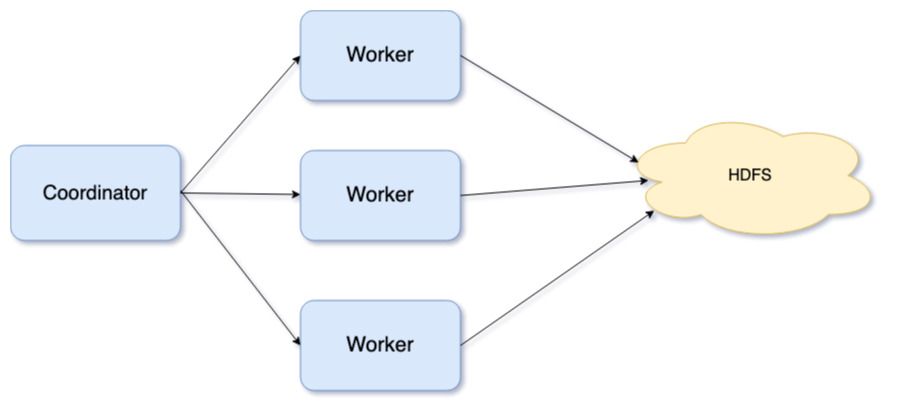
Presto + Data Caching Architecture
To solve sub-second latency use cases, we decided to implement various optimizations. One important optimization was to implement a data cache. Data caching has been a traditional optimization technique to bring the working dataset closer to the compute nodes and reduce trips to remote storage to save latencies and IO.
The challenge was to make the data caching effective when petabytes of data get scanned from the remote data sources with no fixed pattern.
Another requirement for data caching to be effective was to achieve data affinity in a distributed environment like Presto.
With the addition of data caching, the Presto architecture looks like the following:
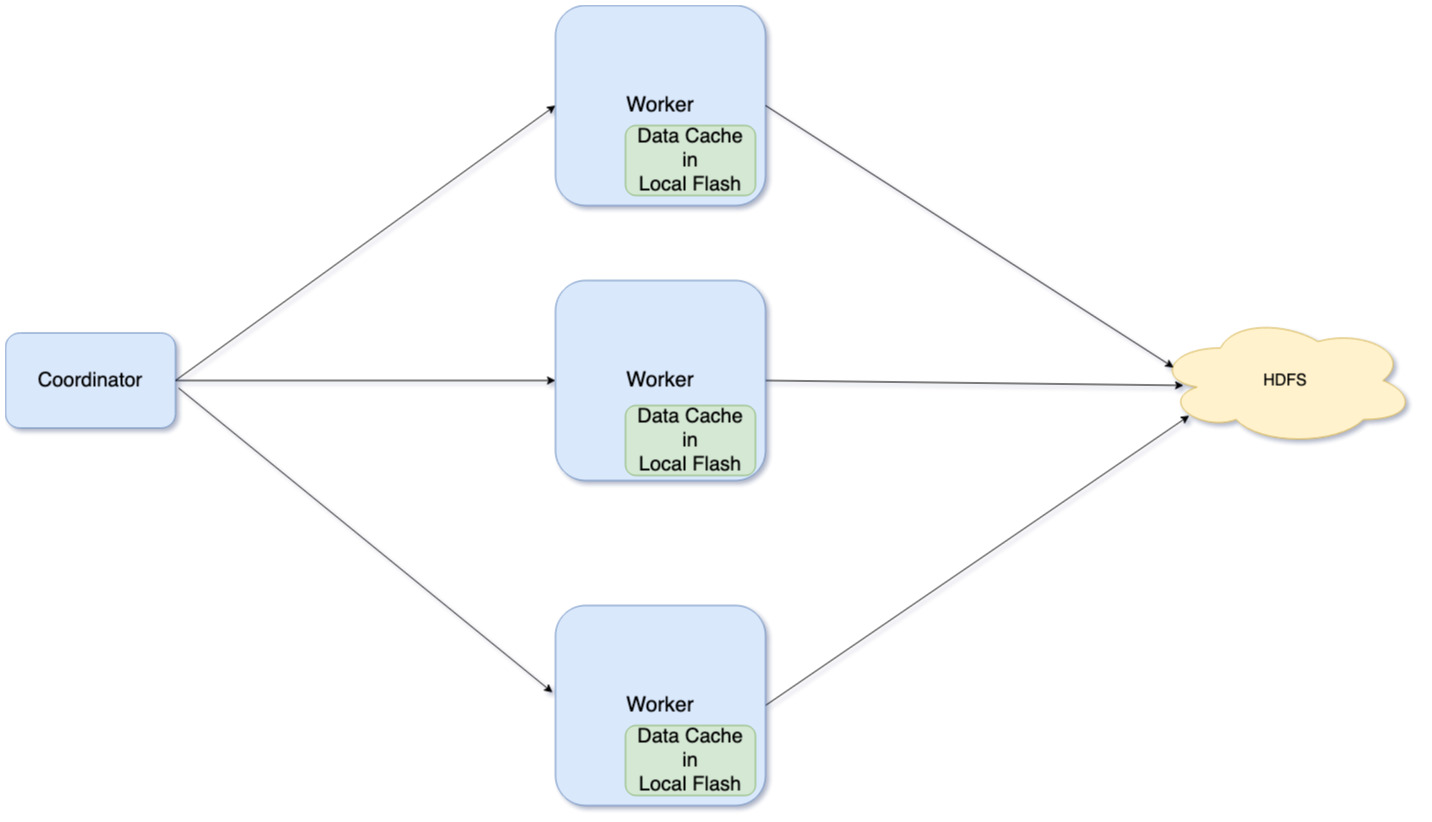
More on this is covered in later sections.
Soft Affinity scheduling
Presto’s current scheduler takes the worker load into account when distributing the splits, such scheduling strategy keeps the workload distribution uniform among workers.
But from the data locality perspective, it distributes splits randomly and not necessarily guarantees any affinity, which is required for any meaningful data caching effectiveness.
It is critical for the coordinator to leverage the same worker for a split which may contain the data for it in its cache.
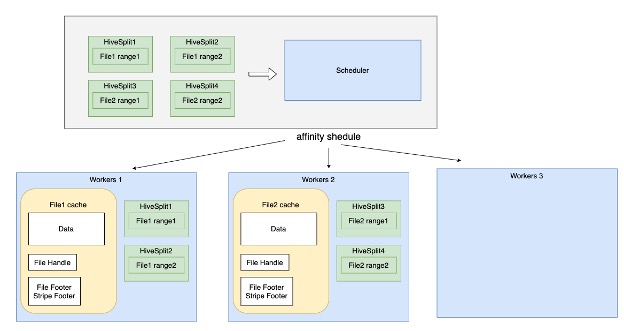
The above diagram illustrates how affinity scheduling distributes various splits among the workers.
Soft affinity scheduling makes the best attempt to assign the same split to the same worker when doing the scheduling. The soft affinity scheduler uses the hash of a split to choose a preferred worker for the split. Soft affinity scheduler:
- Computes a preferred worker for a split. If the preferred worker has resources available then it is assigned the split.
- If the preferred worker is busy then the coordinator chooses a secondary preferred worker, and assigns the split if resources are available.
- If the secondary preferred worker is also busy then the coordinator assigns the split to the least busy worker.
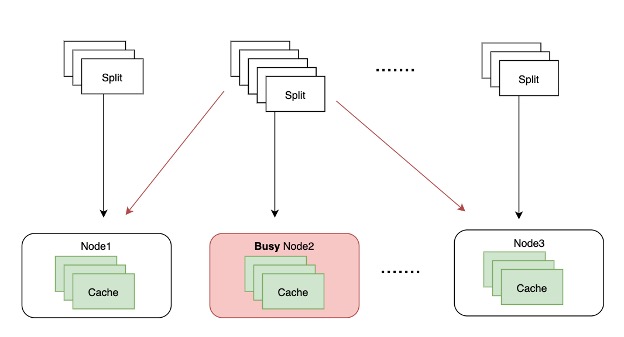
The definition of a busy node is defined by two configs:
- Max splits per node: node-scheduler.max-splits-per-node
- Max pending splits per task: node-scheduler.max-pending-splits-per-task
Once the number of splits on one node exceeds one of the above configured limitations, this node would be treated as a busy node.
As it can be observed, node affinity is absolutely critical for cache effectiveness. Without node affinity, the same split may be processed by
different workers at different times, which can make caching the split data redundant.
Due to this, if the affinity scheduler fails to assign the split to a preferred worker (because it was busy), it signals the assigned worker
to not cache the split data. It means the worker would only cache the split data if it is the primary or secondary preferred worker for the split.
Alluxio data cache
Alluxio file system is an open-source data orchestration system that is often used as a distributed caching service to Presto.
To achieve sub-second query latencies in our architecture, we want to further reduce the communication overhead between Presto and Alluxio.
As a result, core teams from Alluxio and Presto collaborated to carve out a single-node, embedded cache library from the Alluxio service.
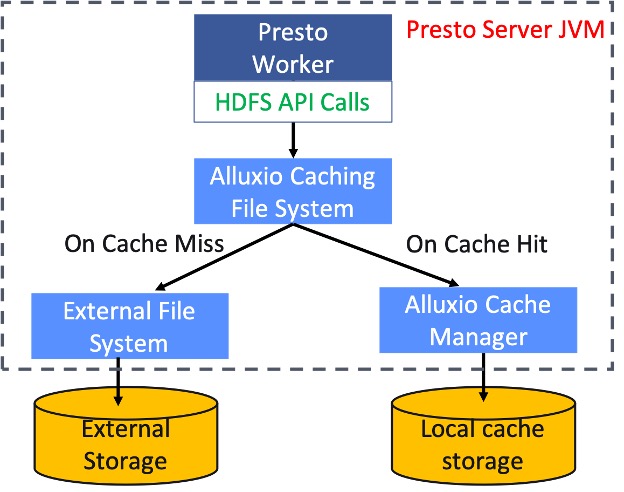
In particular, a Presto worker queries this Alluxio local cache inside the same JVM through a standard HDFS interface.
On a cache hit, Alluxio local cache directly reads data from the local disk and returns the cached data to Presto;
otherwise, it retrieves data from the remote data source, and caches the data on the local disk for followup queries.
This cache is completely transparent to Presto. In case the cache runs into issues (e.g., local disk failures), the Presto reads
fall back to the remote data source. This workflow is shown as the figure below.
Cache internals and configuration
Our Alluxio data cache is a library residing in the Presto worker. It provides an HDFS-compatible interface “AlluxioCachingFileSystem” as the
main interface to Presto workers for all data access operations.
These are some design choices under the hood:
Basic Caching Unit
Both Alluxio experience and earlier experiments from the Facebook team suggested that reading, writing and evicting data in a fixed block size is most efficient. In the Alluxio system the default caching block size is 64MB. This is fairly large mostly to reduce the storage and service pressure on the metadata service. We significantly reduce the caching granularity because our adaptation of the Alluxio data cache keep track of data and metadata locally. We default the cache granularity to units of 1MB "pages".
Cache location and hierarchy
By default, Alluxio local cache stores data into the local filesystem. Each caching page is stored as a separate file under a directory structure as
follows:
<BASE_DIR>/LOCAL/1048576/<BUCKET>/<PAGE>
Here:
- BASE_DIR is the root directory of the cache storage and is set by Presto configuration “cache.base-directory”.
- LOCAL means the cache storage type is LOCAL. Alluxio also supports RocksDB as the cache storage.
- 1048576: represents the 1MB block size.
- BUCKET represents a directory serving as buckets for various page files. They are created to make sure one single directory does not have too many files which often leads to really bad performance.
- PAGE represents the file named after the page ID. In presto the ID is the md5 hash of the filename.
Thread Concurrency
Each Presto worker keeps a set of threads, each executing different query tasks, but sharing the same data cache. Thus this Alluxio data cache is required to be highly concurrent across threads to deliver high throughput. Namely, this data cache allows multiple threads to fetch the same page concurrently, while still ensuring thread-safety for evictions.
Cache Recovery
Alluxio local cache attempts to reuse cache data present in the local cache directory when a worker starts up (or restarts). If the cache directory structure is compatible, it reuses the cache data.
Monitoring
Alluxio exports various JMX metrics while performing various caching related operations. System admins can also monitor the cache usage across the cluster easily.
Presto+Alluxio Benchmark
We benchmarked with queries from one of our production clusters, which was shadowed to the test cluster.
Query Count: 17320
Cluster size: 600 nodes
Max cache capacity per node: 460GB
Eviction policy: LRU
Cache data block size: 1MB, meaning data is read, stored, and evicted in the 1 MB size.
Query Execution time improvement (in milliseconds):

As you can see, we observed significant improvements in the query latencies.
We observed 33% improvement in P50, 54% improvement in P75, and 48% improvement in P95.
IO Savings
Data Size read for master branch run: 582 T Bytes
Data Size read for caching branch run: 251 T Bytes
Savings in Scans: 57%
Cache hit rate:
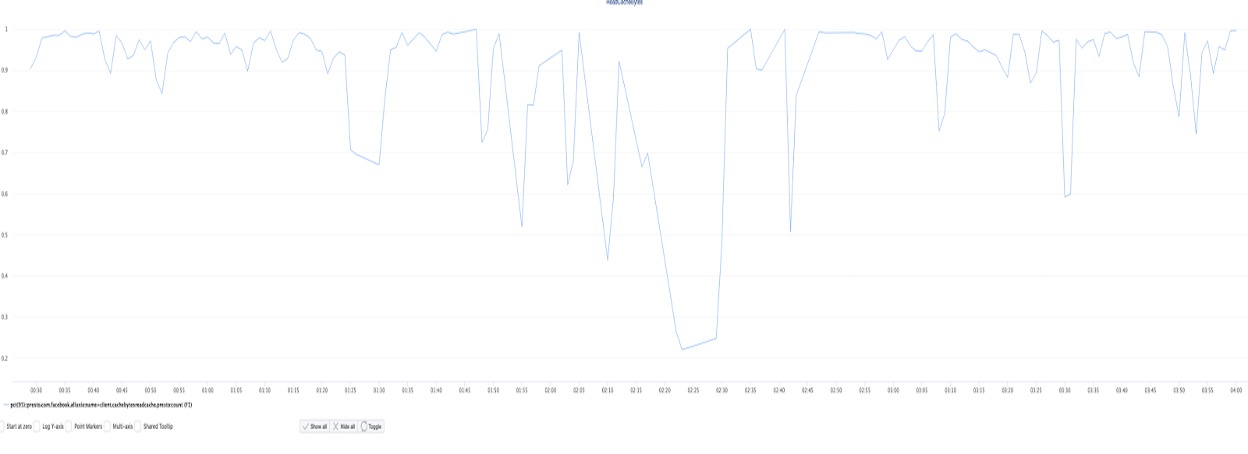
Cache hit rate was pretty consistent and good during the experiment run. It remained mostly between 0.9 and 1. There were a few dips that could be noticed, these can be the result of a new query scanning lots of new data. We need to implement additional algorithms to prevent less frequent data blocks to get cached over more frequent data.
How to use it?
In order to use data caching the first thing we need to do is to enable soft affinity.
Data caching is not supported with random node scheduling.
Set following configuration in the coordinator to enable soft affinity:
"hive.node-selection-strategy", "SOFT_AFFINITY”
To use the default (random) node scheduling, set it to
"hive.node-selection-strategy", "NO_PREFERENCE”
Use the following configuration in the workers to enable Alluxio data caching
- Enable data caching in the worker => "cache.enabled", "true"
- Set the data caching type to Alluxio => "cache.type", "ALLUXIO"
- Set the base directory where the cache data would be stored => "cache.base-directory", "file:///cache"
- Set the max data capacity to be used by the cache per worker: "cache.alluxio.max-cache-size", "500GB"
Here are some other configurations which can useful:
Coordinator configuration (useful to configure the definition of a busy worker):
- Set max pending splits per task: node-scheduler.max-pending-splits-per-task
- Set max splits per node: node-scheduler.max-splits-per-node
Worker configuration:
- Enable metrics for alluxio caching(default: true): cache.alluxio.metrics-enabled
- JMX class name used by the alluxio caching for metrics(default: alluxio.metrics.sink.JmxSink): cache.alluxio.metrics-enabled
- Metrics domain name used by the alluxio caching (default: com.facebook.alluxio): cache.alluxio.metrics-domain
- If alluxio caching should write to cache asynchronously(default: false): cache.alluxio.async-write-enabled
- If the alluxio caching should validate the provided configuration(default: false): cache.alluxio.config-validation-enabled
Alluxio data caching exports various JMX metrics for its caching operations. A full list of metrics names can be found here.
What is next?
- Implement rate limiter to control cache write operations to avoid flash endurance issues.
- Implement semantic aware caching for better efficiency.
- Mechanism to clean cache directories for maintenance or a clean start.
- Ability to execute in dry run mode.
- Ability to enforce various capacity specifications, e.g. cache quota limit per table, cache quota limit per partition or cache quota limit per schema.
- More robust worker node scheduling mechanism.
- Implement additional algorithms to prevent less frequent data blocks to get cached over more frequent data.
- Fault tolerance: The current hash based node scheduling algorithm can run into issues when node count changes in a cluster. We are working on building more robust algorithms, such as consistent hashing.
- Better load balancing: When we take other more factors into account like split size, node resources, then we can better define a “busy” node and thus make more comprehensive decisions when it comes to load balancing.
- Affinity Criteria: Current affinity granularity is file level inside one presto cluster. If we are not able to achieve optimal performance under such a granularity standard, we might adjust our affinity criteria to be more fine-grained and find the balance between load balancing and good cache hit rate to achieve better overall performance.
- Improving resource utilization of Alluxio cache library.

